POWER BI Journey
This repository contains Power BI projects developed as part of the course Microsoft Power BI Desktop for Business Intelligence.
I Learned
I will divide what I learned based on the same course structure:
Data Preparation & Transformation
- Used Power Query Editor for cleaning and shaping data.
-
And Learned:
- Pivoting & Unpivoting data.
- Merging & Appending Queries for combining datasets.
- Creating parameters for flexible source switching (i.e. from dev to prod).
- Managing query refresh strategies.
Data Modelling
- Designed star and snowflake schemas with fact and dimension tables.
- Built hierarchies for drill-down analysis.
- Applied best practices for efficient and scalable models.
DAX (Data Analysis Expressions)
- Created calculated columns and measures for advanced analytics.
-
Implemented:
- Filter context manipulation with CALCULATE, FILTER, and ALL.
- Iterator functions (X functions) for row-by-row aggregation.
- Time Intelligence functions for comparisons.
- Conditional logic (IF, SWITCH, HASONEVALUE).
- Organized measures into dedicated measure tables for clarity.
Visualization & Reporting
-
Built interactive reports with:
- Drill-through filters.
- Custom slicer panels using bookmarks.
- Numeric range parameters for dynamic what-if analysis.
- Custom tooltips.
- Applied data visualization best practices for clarity.
- Managed row-level security roles for user-based access.
Repository Structure
In the course, the project in the AdventureWorks folder, was made following along with the course lectures. The project in the Maven Market folder was made entirely by me.
AdventureWorks
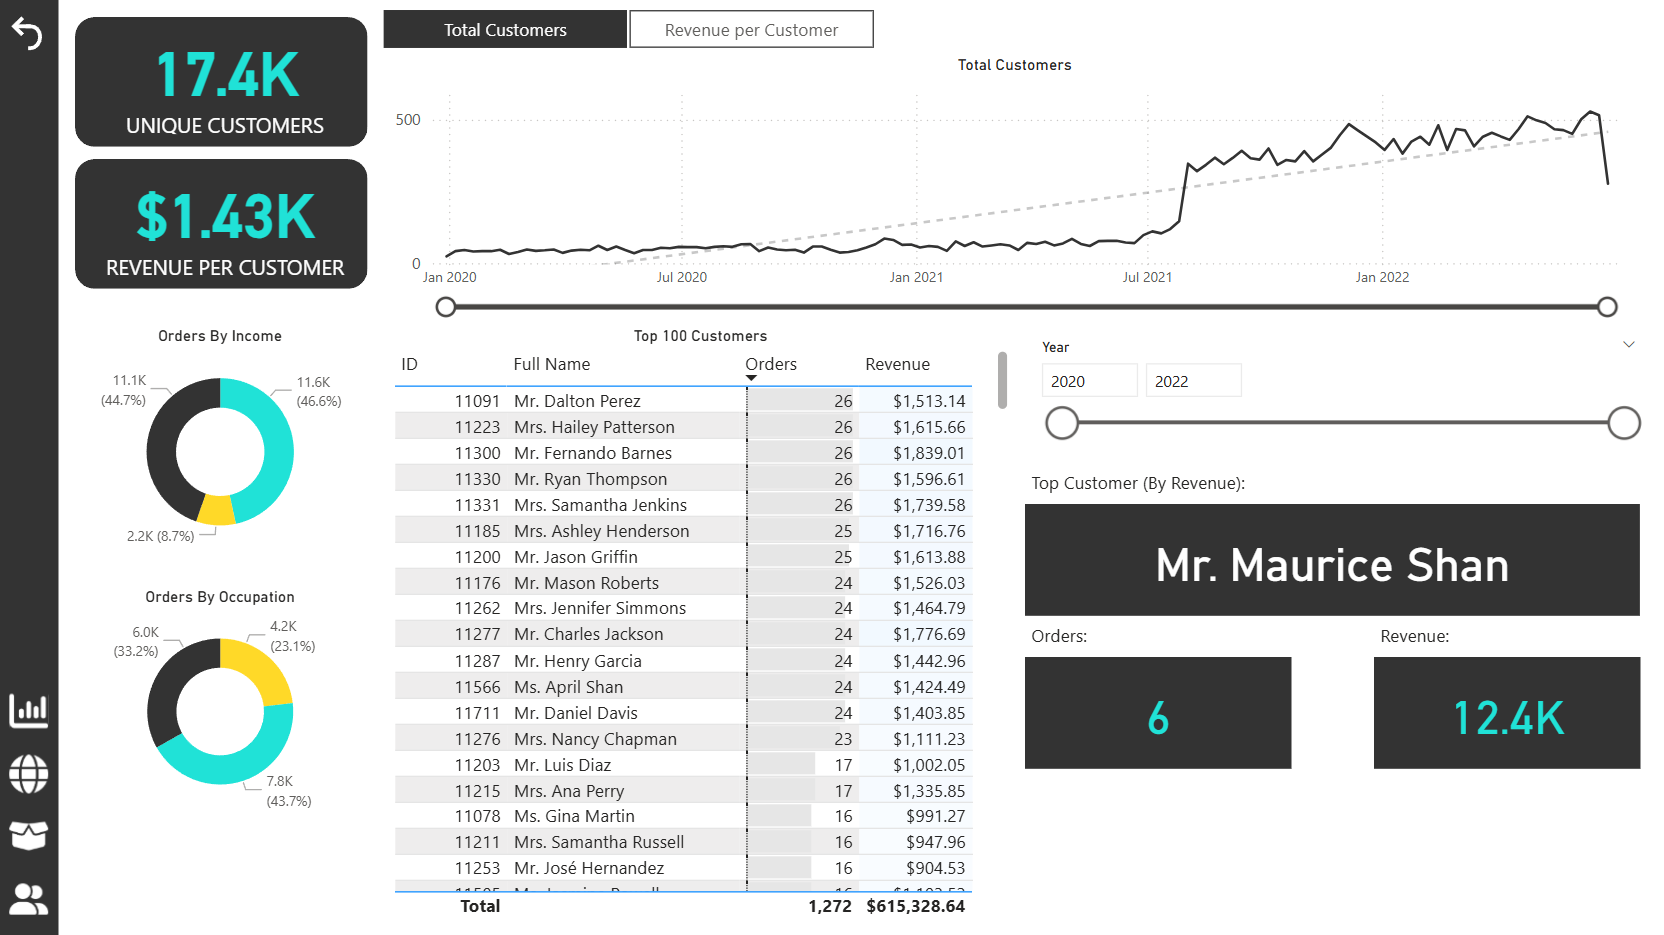
AdventureWorks is a fictional sport store, that asked us to create a report to keep track and to analyze their metrics (such as orders, customers, profit, returns, rates, etc.)
There are 4 main dashboards: the Exec Dashboard which includes a high-level overview of the most important metrics, map which displays a map with the countries where there are registered sales, the product detail which displays information about one single porduct, and the customer detail, which shows information about customers.
This is how they look:
Exec Dashboard
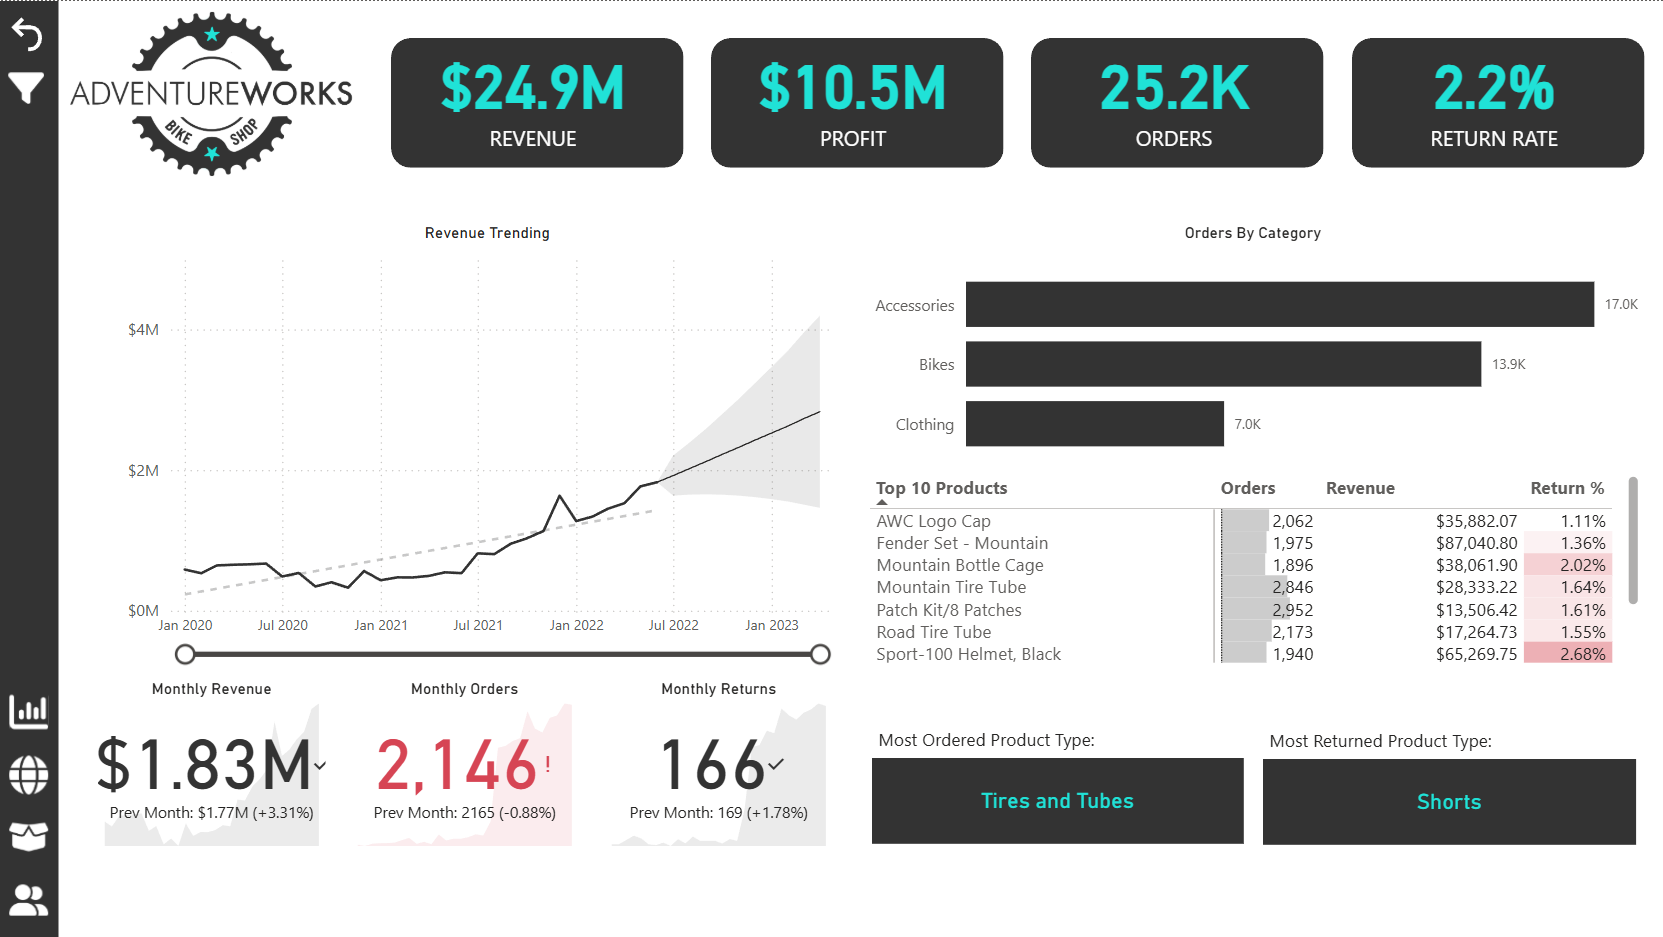
That is how the exec dashboard looks like without filters, there are KPI cards on the top, revenue trending with Power BI's prediction, and some other pieces of information.
This dashboard has a slicer panel, that opens when the filter icon is actioned:
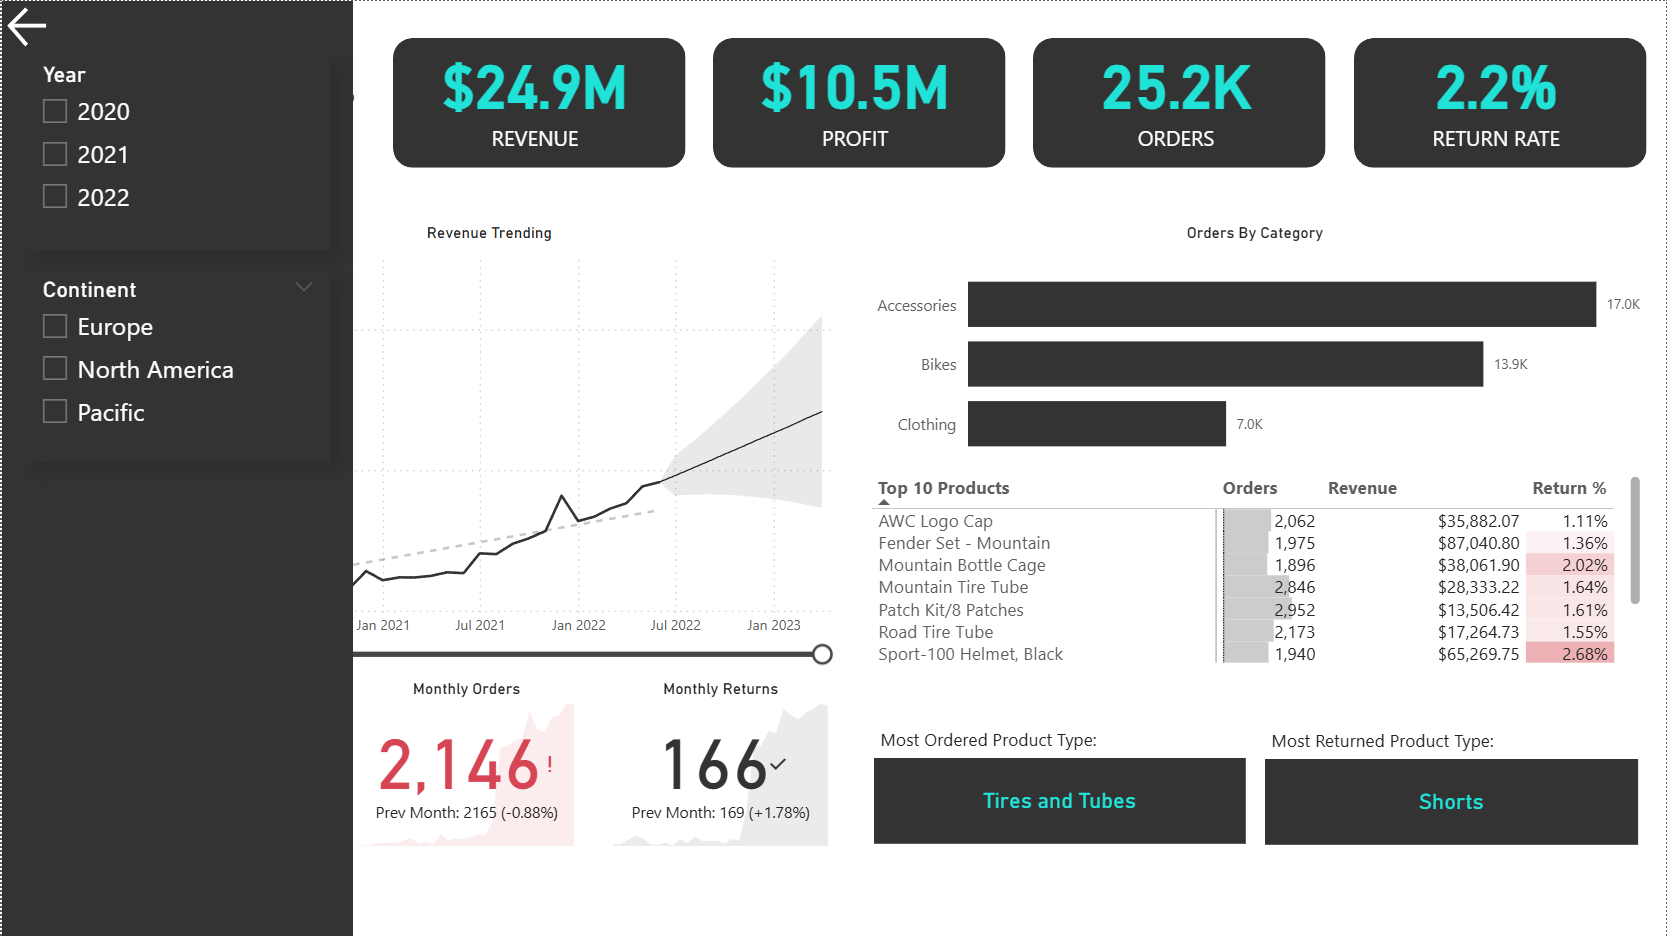
Which can also be closed using the Back arrow (this was achieved using bookmarks).
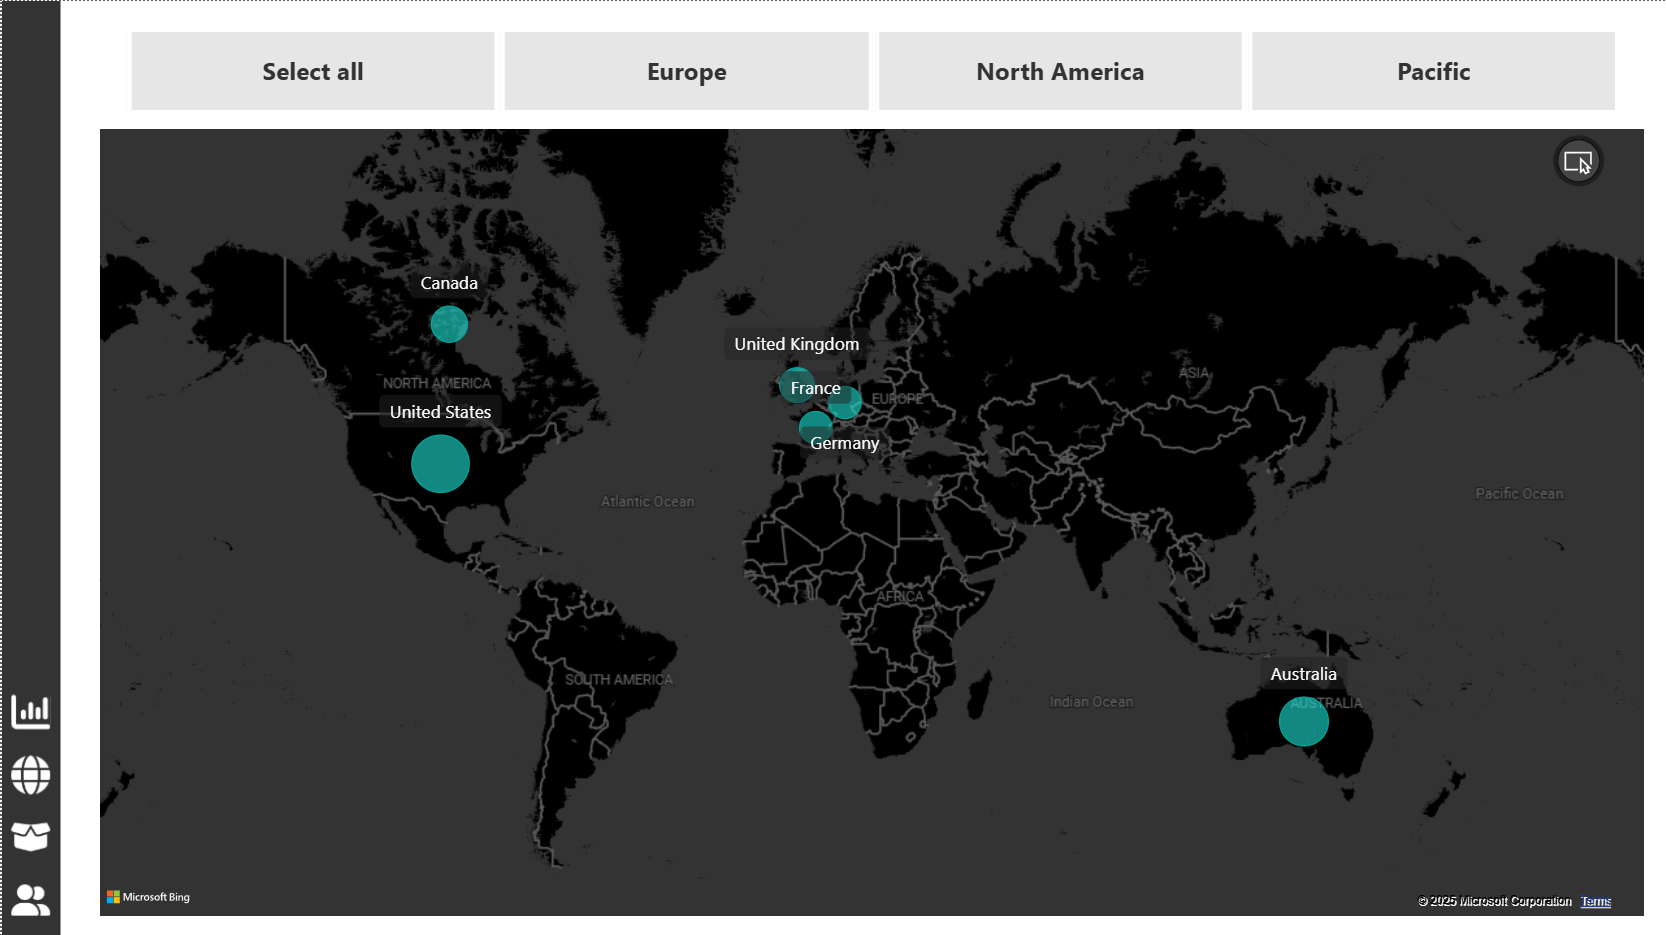
Then, we move to the Map page which might be the simplest of all the pages in this report, as it only shows a map with bubbles (the biggest, the more sales):
There's also the Product Detail page:
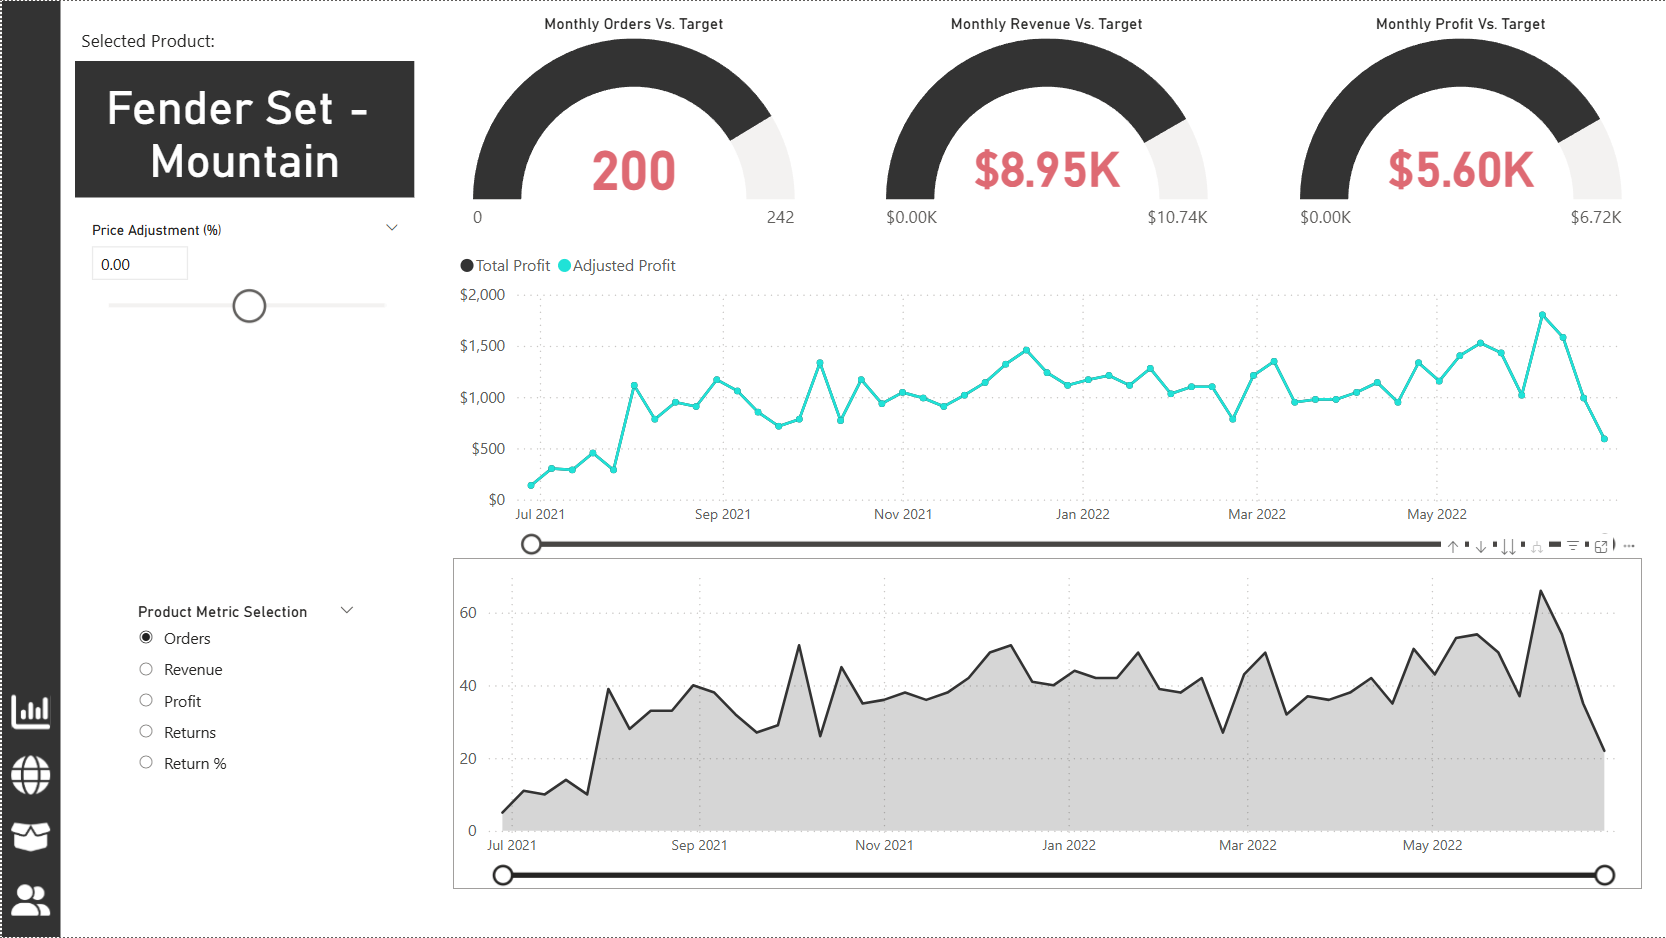
Which is a drill-through page (we can drill-through the Matrix on the Exec Dashboard page that display the products by right-clicking on them).
MavenMarket
WIP